Things you will learn in this article —
1. How to install the JMeter in you system?
2. How to setup JMeter for API load testing?

Installation of JMeter
Steps to do for downloading JMeter —
- Open this Link.
- Under “Binaries” section click on the file which have ‘.zip’ extension, wait for few minutes and it will download JMeter.
- Now extract that zip file.
- After extracting open it and go inside the ‘bin’ folder.
- Here you will find a file named “ApacheJMeter”, double click on it which opens JMeter into your system.
In case you are not able to open JMeter by double click on “ApacheJMeter” file, follow this —
- Locate the folder in which “ApacheJMeter” file is present.
- In search bar, type ‘cmd’ and press Enter. It will open terminal window in your system.
- Here you can type this command “javaw.exe -jar ApacheJMeter.jar” and press enter and boom JMeter will open.
Note — You must have installed JavaSDK in your system to use JMeter because JMeter is 100% pure Java application.
Now moving forward and learn how we can use JMeter to do Load Testing on APIs.
JMeter setup for API Load Testing
Follow these steps for setup —
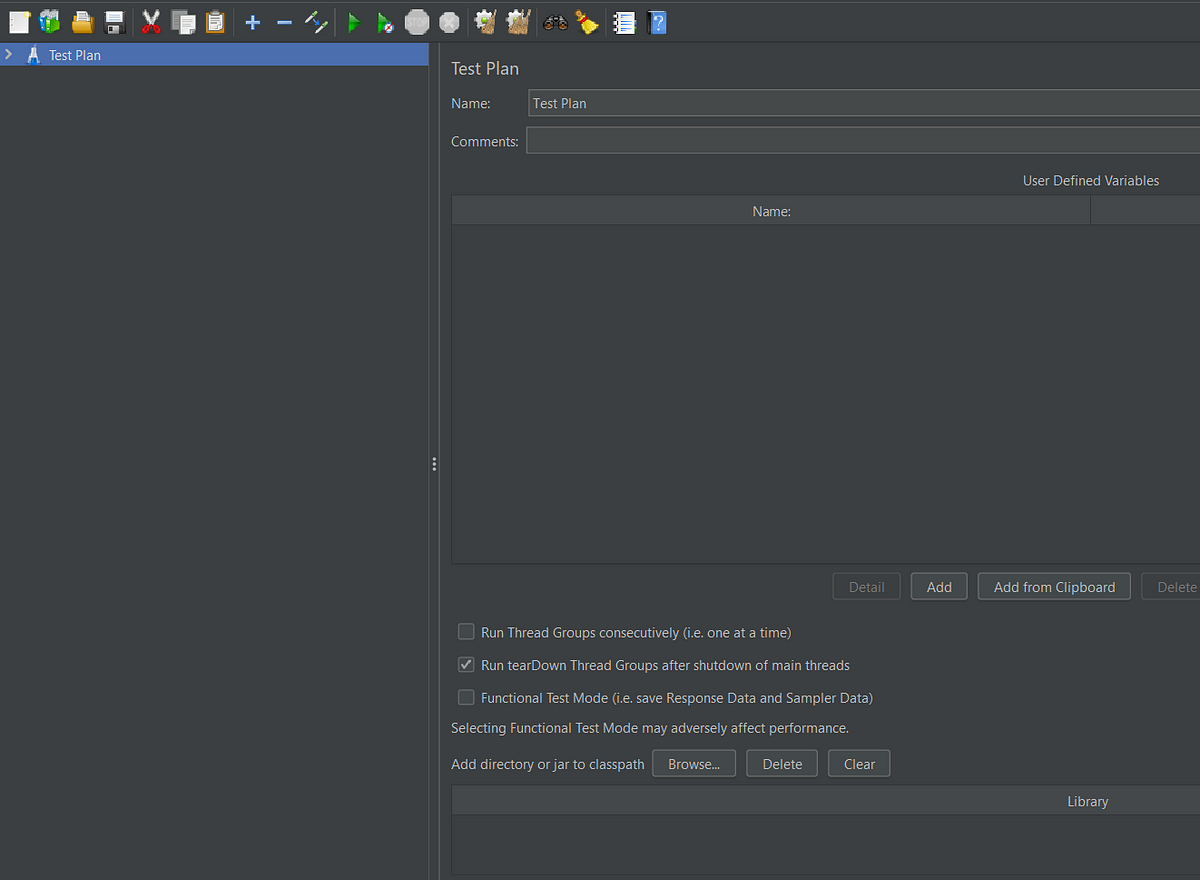
In JMeter, if you see at right side of JMeter window then you will see a text named ‘Test Plan’(you can rename it) we will treat it like a folder and all APIs are come under this Test Plan folder.
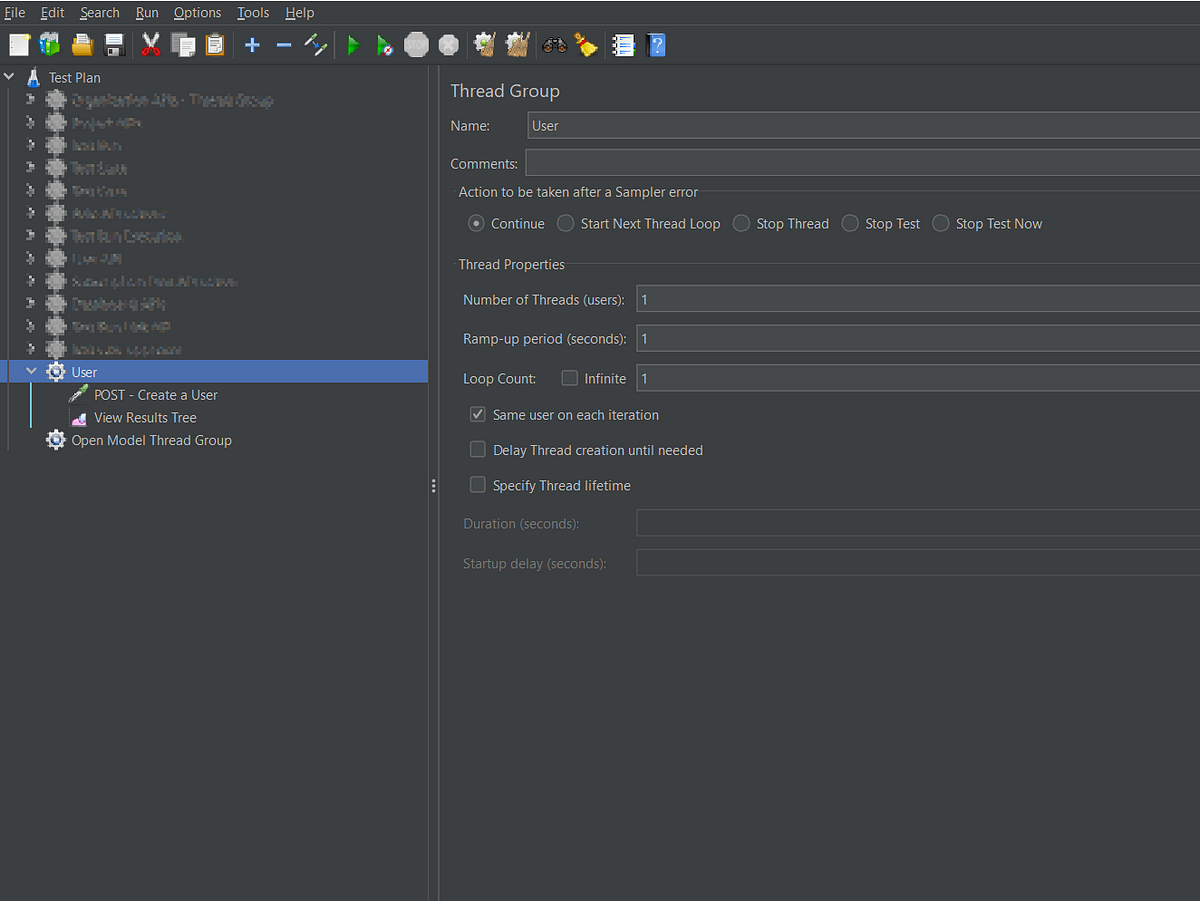
First of all we need a Thread Group in which we can write our APIs of one kind such as if we are doing operations on user then create, delete, update, get and soon comes under this thread group. To do this —
Right Click on TestPlan → Add → Threads(Users) → ThreadGroup
(we can change this thread group name).
We have three important fields in Thread Group section —
Number of Threads (Users) — This means that for how many virtual users you want to hit your API such as 50, 100.
Ramp-up period (seconds) — Time taken by JMeter in which API is hit for all the threads(virtual users). For example — If Number of Threads is 100 and Ramp-up period is 50 then 100/50 = 2 threads(users) hit the request per second.
Loop Count— If defines for how many times a single thread repeats for example if we have 5 threads and Loop Count is 3 then the same API will hit 15 times.

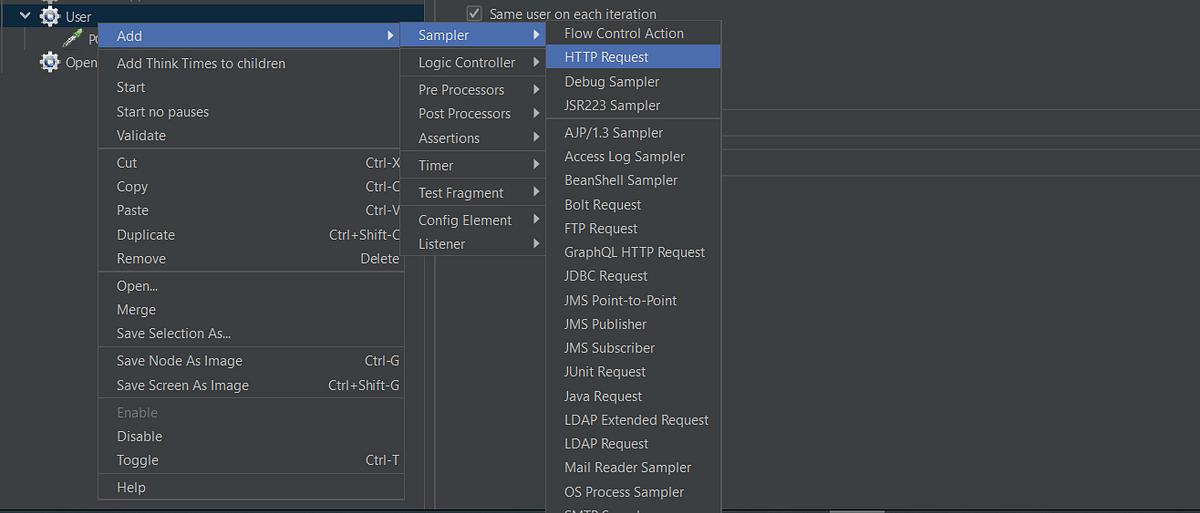
After adding Thread Group, we have to add a HTTP Request in which we are going to add information about API such as path, type of API etc. To do this — Right Click ThreadGroup → Add → Sampler → HTTP Request
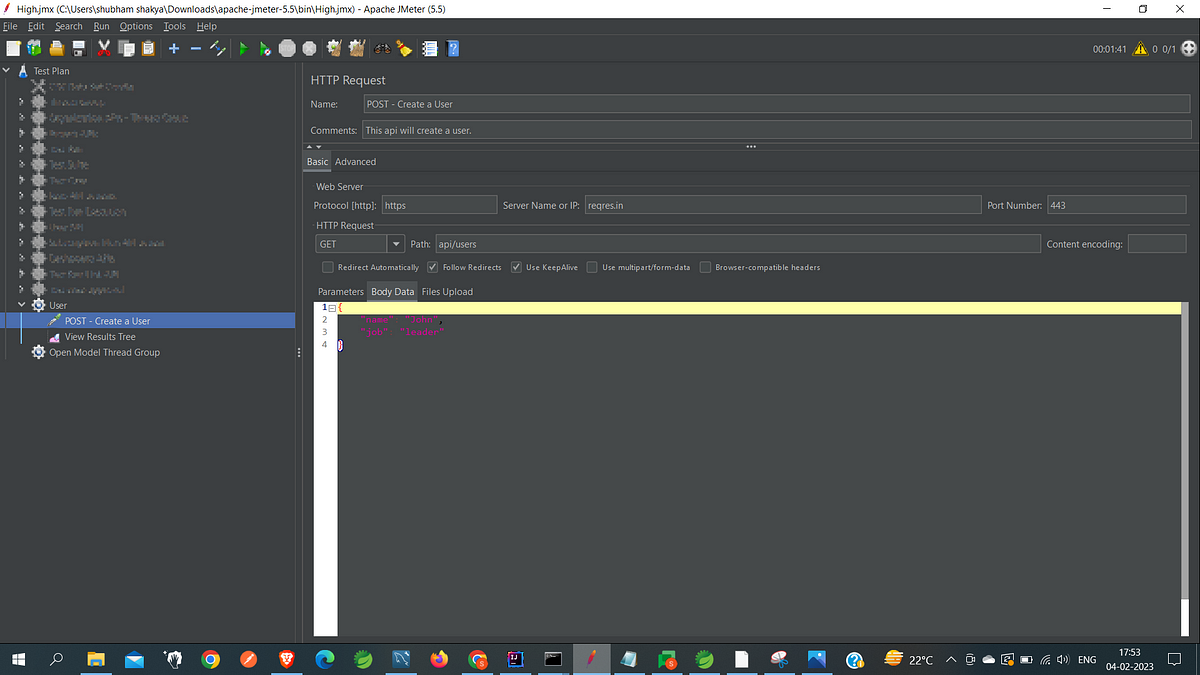
Now fill the fields which are present in HTTP Request —
Name — Name of HTTP Request e.g. POST — Create a User
Comments — You can write if you required otherwise leave it blank.
Protocol — Mention the protocol you are using either https or http.
Server Name or IP — Your server name or IP for example if you are testing API locally then you can write ‘localhost’.
Port Number — Port number on which your API is functioning such as for https request we use 443 and for http we use 80 port number.
Path — mention the path of the API and select the type of API(POST,GET,PATCH,DELETE etc.)
Parameters — In this section you can mention the additional parameters
which are needed to make http request.
Body data — Add the body data in json format such as when we create a user we need its name, age, birthdate etc.
Files upload — You can upload a file here if required.
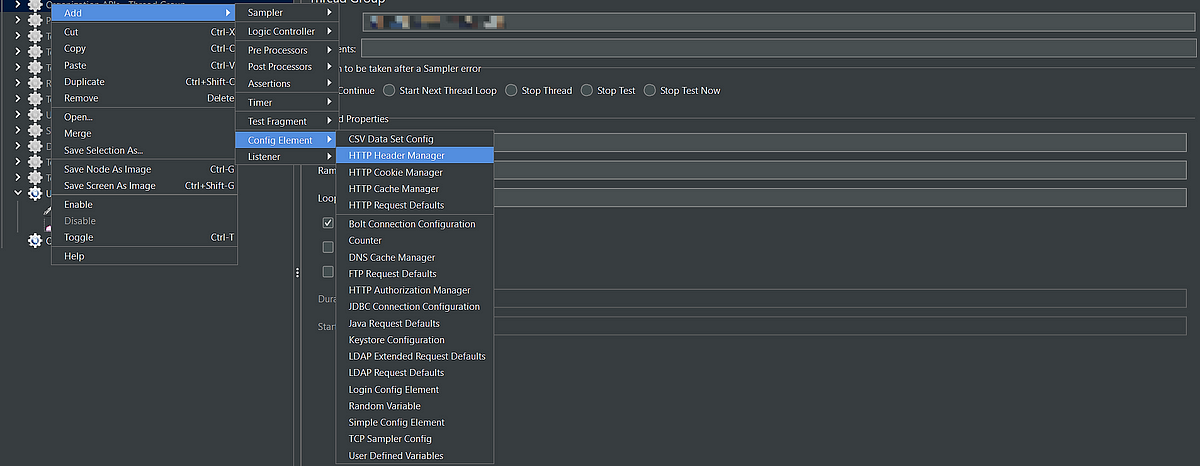
We need HTTP Header Manager for mentioning headers of your http request such as Authorization Token if you are using it in your API or Content-Type. To add “HTTP Header Manager” — Right click on Thread Group → Config Element → HTTP Header Manager.
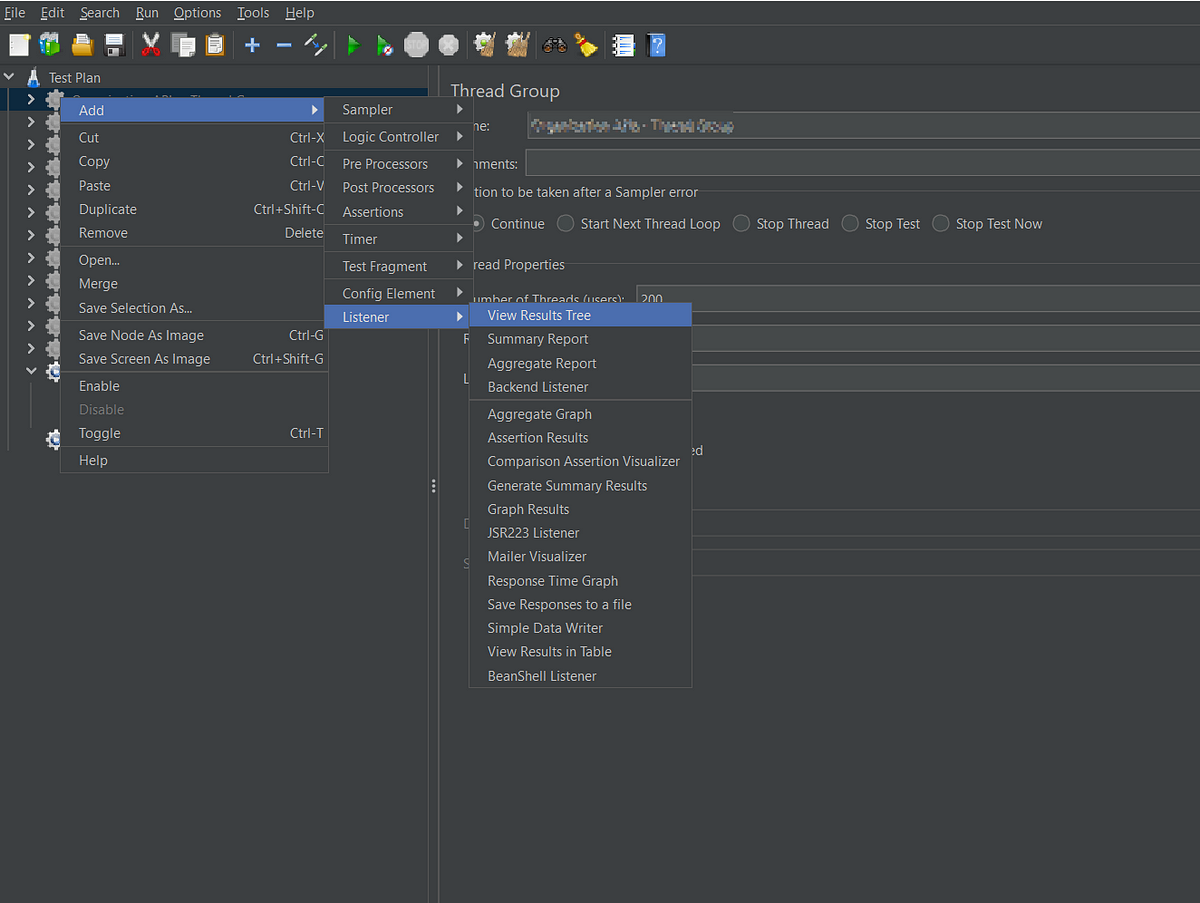
To see the results of our APIs, we have to add View Results Tree. To do this — Right click on Thread Group → Listener → View Results Tree.
Note — we can also add “View Results Tree” at Test Plan level.
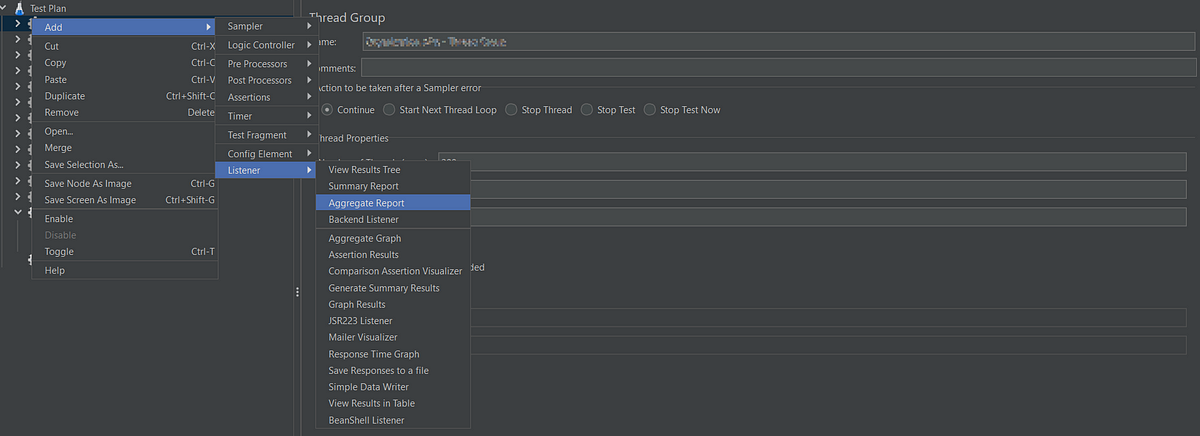
To see the report of all API requests, we need to add Aggregate Report section. To do this — Right click on ThreadGroup → Listener → Aggregate Report.
Note — we can also add “Aggregate Report” at Test Plan level.
Now moving forward look how we can execute the above created API—
For this API, I am taking Number of Threads (Users) is 10, Ramp-Up time is 2 seconds and Loop Count is 5 which means that the Create User API will 50 times in 10 seconds.
Before executing the API make sure that the Test Plan, Thread Group and HTTP Request is enable. If any of them is not enabled the API will not work to enable them right click on it and choose option enable.
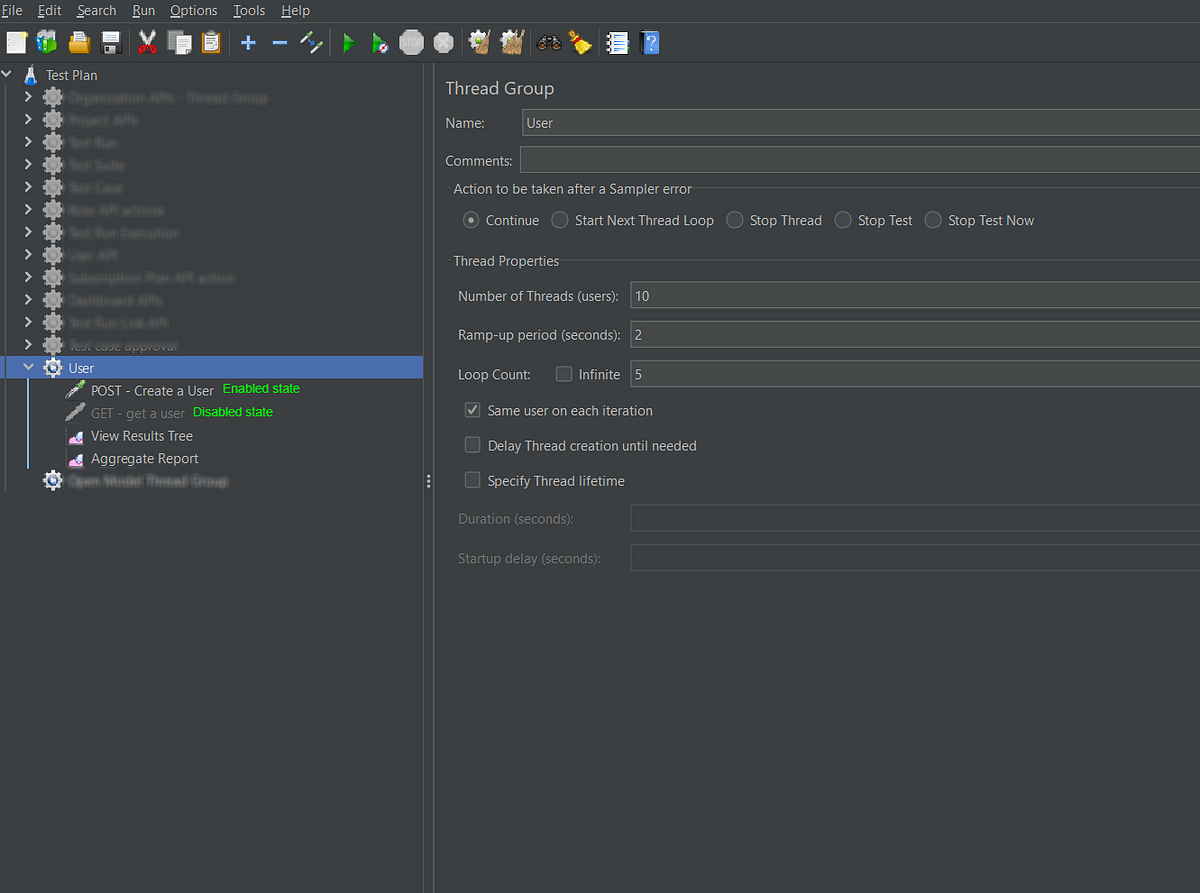
Now everything is set up and we are ready to execute our first API using JMeter —
At the top of the JMeter, a triangular shaped green button is present . As you press that button our Create User API will start executing with the given configurations and we can see the results of our API in View Result Tree and combine report of all the request in Aggregate Report.

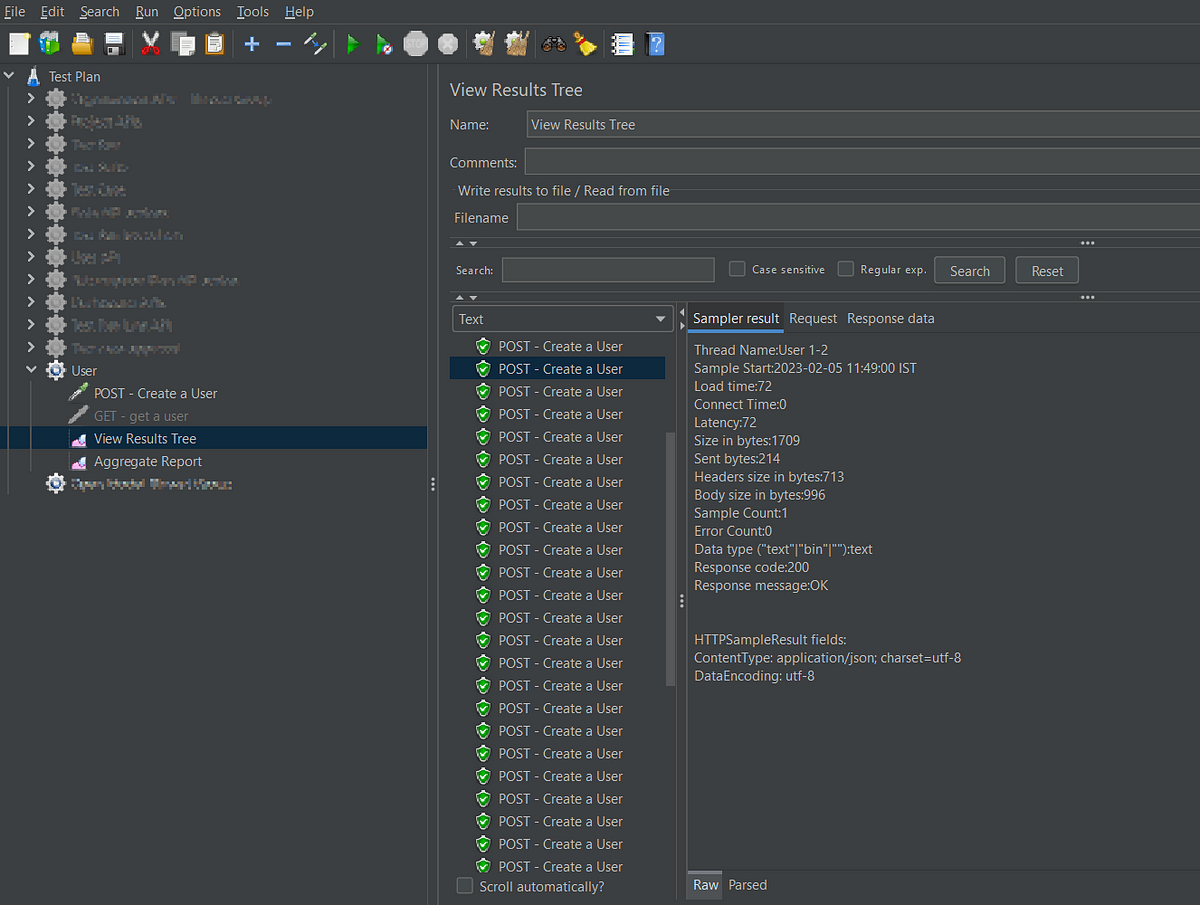
The Sampler result tab contains the response code, headers, cookies and information about time, latency, response size in bytes.
The Request tab contains information about request body and headers such as Auth Token, content-type, cookie information etc.
The Response data tab contains the response body of the request.
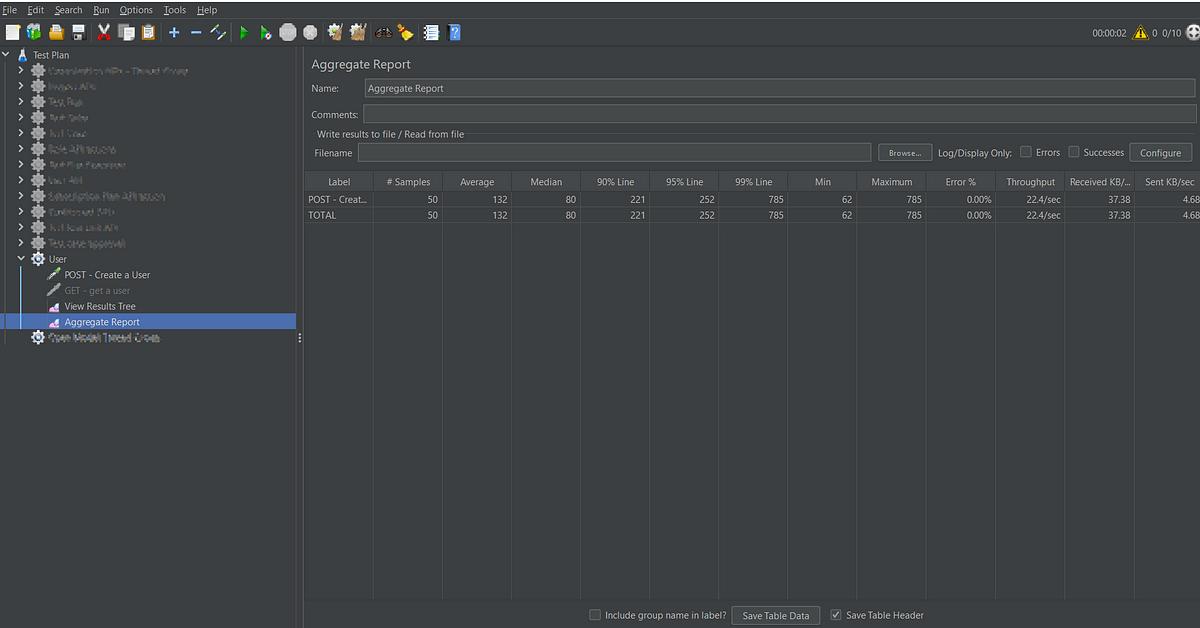
- Label: Name of the HTTP request.
- Sample: The total number of times API hit for given configuration.
- Average: Average time taken by all API hits. In the above example, the total average time is 132 milliseconds as shown in the above screenshot.
- Median: It demonstrates that half of the requests took this time i.e. the rest of at minimum as long.
- 90% Line: 90% of the requests took no more than this time. The remaining samples took at least this time.
To calculate 90%, arrange the request in descending order on the basis of their time and now exclude the 10% request from top. The highest value left is 90%. - 95% Line: 95% of the samples took no more than this time. The remaining samples took at least this time.
To calculate 95%, arrange the request in descending order on the basis of their time and now exclude the 5% request from top. The highest value left is 95%. - 99% Line: 99% of the samples took no more than this time. The remaining samples took at least this time.
To calculate 99%, arrange the request in descending order on the basis of their time and now exclude the 1% request from top. The highest value left is 99%. - Min: The minimum amount of time taken by that HTTP request.
- Max: The maximum amount of time taken by that HTTP request.
- Error%: It shows failed HTTP requests per label.
- Throughput: It shows a number of requests are processed per second.
- KB/Sec: It is used to show the average amount of data received from the server during Test Plan execution.
