Google Analytics is a powerful tool for tracking and analyzing website traffic, but if you want to use that data in your own custom dashboard, you’ll need to access it through the Google Analytics API. Here’s a step-by-step guide on how to get started.

Step 1: Set up a Google Analytics account
Before you can access the Google Analytics API, you’ll need a Google Analytics account. If you don’t already have one, sign up for a free account on the Google Analytics website.
Step 2: Create a project in the Google Cloud Console
Next, you’ll need to create a project in the Google Cloud Console. Go to the Google Cloud Console website, sign in with your Google account, and create a new project. Give it a name and choose a billing account (if you have one) or create a new one.
Step 3: Enable the Google Analytics API

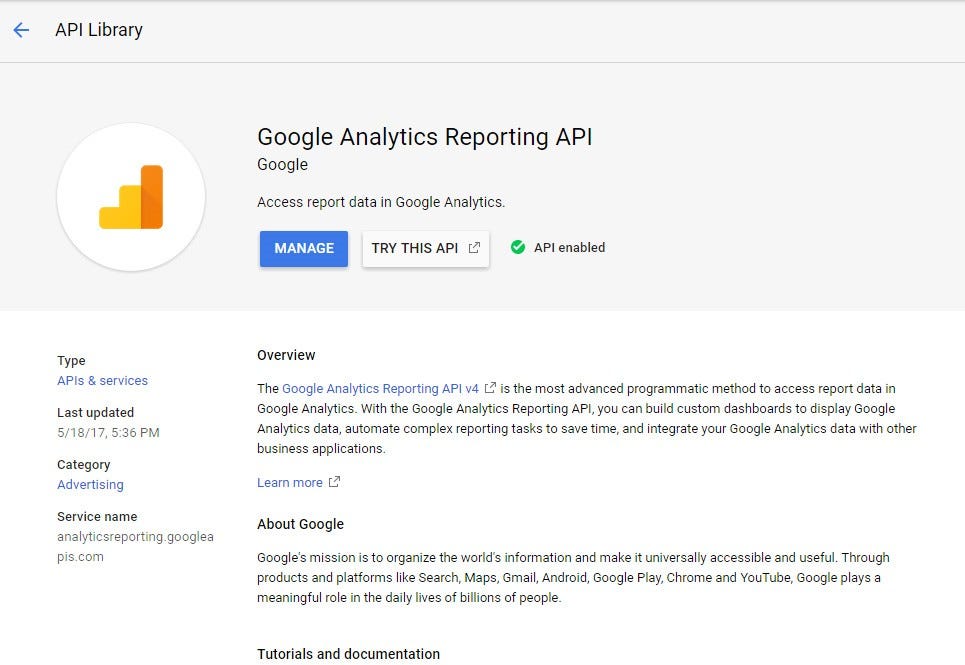
Once a project is set up, you’ll need to enable the Google Analytics API. To do this, go to the “APIs & Services” dashboard in the Google Cloud Console and search for “Google Analytics API”. Click on the API to enable it for your project.
Step 4: Create a Service Account
Next, you’ll need to create a service account. A service account is a Google account that belongs to your application or a virtual machine (VM) instead of an individual end user. To create a service account, go to the “APIs & Services” dashboard, click on “Credentials”, and then click on “Create credentials”. Choose “Service account” and give it a name.
Step 5: Grant permissions to the Service Account
To access your Google Analytics data, you’ll need to grant permissions to the service account you just created. To do this, go to the Google Analytics website and select the account you want to access. Click on “Admin” and then click on “User Management”. Add the email address of the service account you created in step 4 and grant it “Read & Analyze” permissions.
Step 6: Download a private key file
The last step is to download a private key file for the service account. To do this, go back to the “Credentials” dashboard in the Google Cloud Console and click on the name of the service account you created. Click on “Add Key” and choose “JSON”. Download the file and keep it secure, as it gives access to your Google Analytics data.
Step 7: Integrate the API into your dashboard
Now that you have a private key file and a service account with the necessary permissions, you can start integrating the Google Analytics API into your own dashboard. You can use any programming language that supports REST API calls, such as Python or JavaScript, to access the API and retrieve your Google Analytics data.
Example: Retrieving the number of sessions and pageviews for a specific date range in Python
import requests
import json

# Define the API endpoint and the parameters to pass
endpoint = 'https://analyticsreporting.googleapis.com/v4/reports:batchGet'
params = {
  'access_token': 'YOUR_ACCESS_TOKEN',
  'reportRequests': [
    {
      'viewId': 'YOUR_VIEW_ID',
      'dateRanges': [
        {
          'startDate': '2023-01-01',
          'endDate': '2023-01-31'
        }
      ],
      'metrics': [
        {
          'expression': 'ga:sessions'
        },
        {
          'expression': 'ga:pageviews'
        }
      ]
    }
  ]
}

# Make a POST request to the API endpoint
response = requests.post(endpoint, json=params)

# Check if the request was successful
if response.status_code == 200:
  # Extract the data from the response
  data = json.loads(response.text)

  # Use the data in your dashboard
  print(data)
else:
  # Handle the error
  print('Error:', response.text)
This code uses the requests library to make a POST request to the Google Analytics API endpoint (https://analyticsreporting.googleapis.com/v4/reports:batchGet). The parameters for the API request are defined in a params dictionary.
The params the dictionary contains a access_token key, which should be set to a valid access token, and a reportRequests key, which is an array of report requests. In this example, we’re only making one report request.
The report request contains a viewId key, which should be set to the ID of the view you want to retrieve data for, and a dateRanges key, which specifies the date range for the report. In this example, we’re retrieving data for the month of January 2023.
The report request also contains a metrics key, which specifies the metrics to include in the report. In this example, we’re including the ga:sessions metric, which represents the number of sessions on your website and ga:pageviews for counting the page views.
Once the API request has been made, the response is checked for a status_code of 200, which indicates a successful response. If the response is successful, the data is extracted from the response and can be used in your dashboard. If the response is not successful, an error message is displayed.
You can get the dimensions and metrics from the documentation to embed in the API as per the requirements.
https://developers.google.com/analytics/devguides/reporting/data/v1/api-schema
There are many resources available online to help you with this final step, including the Google Analytics API documentation. Once you have the data, you can use it to create custom charts, graphs, and reports to display in your dashboard.
Conclusion
Integrating the Google Analytics API into your own dashboard is a powerful way to access your website traffic data and use it to make informed decisions. By following these seven steps, you can start using the Google Analytics API to create a custom dashboard that meets your specific needs.
